Fiscal 2020 Deficit Through January

The graph below compares the U.S. federal deficit by month to the prior fiscal year. Through the first four months of Fiscal 2020, the U.S. deficit was $388 billion, which is $78 billion more than Fiscal 2019.

The deficit for January 2020 increased by $55 billion due to February payments that were made in January. It was a timing shift that occurred because February 1 was a Saturday. A similar timing shift will occur in February, since March 1 will fall on Sunday. These timing shifts will equalize by the end of March, which is halfway through the fiscal year.

Excluding the $55 billion timing shift, the Fiscal 2020 deficit is approximately 7.5% higher than last year. Based on current projections, the U.S. deficit will exceed $1 trillion, which hasn’t happened since 2012.

FY 2020 Deficit January.jpg

Fiscal 2019 Deficit by Month

Below is a chart comparing the monthly deficit or surplus of the United States with the prior fiscal year (October 1 through September 30). During Fiscal 2019, the federal government overspent by $984 billion, which is $205 billion more than the $779 deficit for Fiscal 2018.

As a percentage, the U.S. deficit rose by a whopping 26.3%. Fiscal 2019 receipts increased by 4%, but spending increased by twice as much. You don’t have to be a financial wizard to recognize there is a problem when spending is increasing at twice the rate of revenues. This trend is not sustainable.

Does it alarm you the federal government overspent by nearly $1 trillion last year, and that spending is growing twice as fast as revenues?

FY 2019 Deficit September.jpg

Fiscal 2019 Deficit Through August

Below is a chart tracking the monthly deficit of the U.S. government for the current fiscal year, in comparison to last year (Fiscal 2018). The deficit through the first eleven months was in excess of $1 trillion. Since September is a month when tax payments are due, the September surplus should push the deficit for the year below $1 trillion… but not by much.

Since September 1 occurred on the weekend, certain payments that would normally be paid in September were paid in August. This shift in timing increased the August deficit by $24 billion. A similar timing shift happened in 2018. Even with this timing differential, the year-to-date deficit is $168 billion more than last year.

What do you think about federal spending that has exceeded revenues by more than $1 trillion over the past 11 months?

FY 2019 Deficit August.jpg

Fiscal 2019 Deficit Through July

Below is a chart comparing the current year U.S. budget deficit with the prior fiscal year. Through the end of July, the federal government has overspent by $867 billion.

The current year-to-date deficit is $182 billion more than the deficit through July 2018. It’s also more than the deficit for all of Fiscal 2018 (the fiscal year ends on September 30). Based on the current spending, the annual deficit for Fiscal 2019 will exceed $1 trillion.

The last time the deficit exceeded $1 trillion, the U.S. was spending to stave off another Great Depression. At present, the economy is not in recession. Instead, the stock market is reaching all-time record levels, unemployment is at records lows and the economy is booming. Despite these prosperous times, Congress and the President continue to overspend with little regard for the future, or how the U.S. national debt is going to be repaid.

Are you concerned with a $1 trillion annual deficit in the midst of economic prosperity?

FY 2019 Deficit July.jpg

Fiscal 2019 Deficit Through May

The chart below compares the U.S. government’s monthly deficit or surplus for Fiscal Year 2019 with Fiscal Year 2018. Through the end of May, which is seven months into the fiscal year, the U.S. government has overspent by $738 billion.

To make a fair comparison, the May deficit is $50 billion higher, because of June payments made in May. Since June 1 was on Saturday, certain expenditures were paid in May instead of June. If you subtract out this extra $50 billion the deficit was still $688 billion, which is still $155 billion more than the prior seven month period. The CBO still estimates the Fiscal 2019 deficit will be less than $1 trillion, but it wouldn’t take much disruption, either from an economic slowdown or unexpected expenditures, to push beyond the $1 trillion mark.

Excluding the $50 billion timing, the U.S. government is overspending in excess of $22 billion per month. How does that affect you?

FY 2019 Deficit May.jpg

Fiscal 2019 Deficit Through April

The chart below tracks the monthly deficit or surplus of the U.S. government for the current fiscal year, in comparison to the prior year. The deficit through April (the first seven month of the fiscal year) was $531 billion. This is $145 billion more than the first seven months of Fiscal 2018.

According to a recent CBO projection, the U.S. deficit will be near $900 billion by September 30. This is expected to be $100 billion more than the Fiscal 2018 deficit, but less than the initial estimate of $1 trillion. In order to meet this projection, the deficit for the next five months will need to be nearly the same as May through September of 2018.

How likely do you think the federal deficit for the next five months will be equal to the deficit for the same period last year?

FY 2019 Deficit April.jpg

Fiscal 2019 Deficit through March

The U.S. government’s deficit for Fiscal 2019 through March 31st was $693 billion. This is $103 billion more than the first half of of Fiscal 2018.

The deficit for Fiscal 2019 is expected to exceed $1 trillion. Consequently, the overspending for the next six months is expected to be approximately 50% less than the first six months. The tax payments received in April are the primary reason the deficit will be much less, as the Federal government will continue to spend at nearly the same rate as the last six months.

How concerned are you with a deficit that is more than $100 billion greater than last year; a 17.5% increase?

FY 2019 Deficit March.jpg

Fiscal 2019 Deficit through February

Below is a graph tracking the monthly surplus or deficit in comparison to the prior fiscal year.

Through the end of February 2019, the U.S. government has overspent by $537 billion. The Fiscal 2018 deficit through February was $391 billion. Therefore, the federal government has spent an additional $146 billion through the first five months of this fiscal year.

Revenues collected by the U.S. Treasury were essentially the same as the prior fiscal year. However, spending increased by nearly 6%. If revenues are not growing but expenses are, it’s easy to see why the annual deficit continues to rise.

How sustainable do you think it is for government spending to increase 6% more than revenues each year?

FY 2019 Deficit February.jpg

Fiscal 2019 Deficit Through November

The chart below compares the U.S. deficit by month with the prior fiscal year. In the first two months of the year, the U.S. has overspent by $303 billion, which is $101 billion more than last year.

Since December 1, 2018 fell on a Saturday, certain payments that would have been made in December were accelerated into November. Subtracting the timing of those payments, the deficit would have been $229 billion. Considering there were 61 days in October and November, the U.S. government spent $3.75 billion more each day than it received. With a projected deficit of nearly $1 trillion this year, the overspending will decrease to an average of $2.75 billion per day.

How long do you think the U.S can continue overspending nearly $3 billion each day?

FY 2019 Deficit November.jpg

Fiscal 2018 Deficit through August

The chart below compares the monthly deficit for Fiscal 2018 with Fiscal 2017. The cumulative deficit for the first 11 months of the year is $895 billion.

The federal government recorded a whopping $210 billion deficit for August. Since September 1 occurred on Saturday, the government paid approximately $55 billion of expenditures in August which normally would have been paid in September. Excluding this timing difference, the U.S. still would have overspent by $155 billion.

The acceleration of the $55 billion payments into August and the September tax collections will likely result in a monthly surplus for September. However, the U.S. government will overspend in excess of $800 billion this year.

Are you concerned the federal government will record a deficit in excess of $800 billion this year?

FY 2018 Deficit September.jpg

Fiscal 2018 Deficit Through July

The chart below compares the monthly deficit or surplus for the current fiscal year with Fiscal 2017. The U.S. government posted a $74 billion deficit in July, which is $31 billion more than July 2017.

The cumulative deficit through July 2018 is $682 billion; $118 billion more than the $564 billion deficit through July 2017. Based on current projections, the federal government will overspend another $111 billion over the next two months pushing the Fiscal 2018 deficit to $793 billion. 

Congress is currently working on the Fiscal 2019 budget and spending bills. Absent any significant changes, which is unlikely with the mid-term 2018 elections a few weeks away, the federal government will spend $1 trillion more than it collects during Fiscal 2019. 

Even though the U.S. is on the verge of indefinite trillion budget deficits, why do you think fiscal matters are barely mentioned during this election cycle?

FY 2018 Deficit July.jpg

Fiscal 2018 Deficit Through May

The chart below compares the monthly U.S. deficit for Fiscal 2018 with Fiscal 2017. Through the end of May, the current year deficit is $530 billion, which is nearly $100 billion more than last year. Given the overspending to date, the federal government will likely spend approximately $800 billion more than it collects this year.

One of President Trump's economic advisers recently claimed the deficit was declining. This simply is not true. The Fiscal 2018 deficit is projected to be $125-150 billion more than last year's deficit of $666 billion. Since the federal government has overspent by nearly $530 billion over the past 8 months,  there is no way the current deficit will be less than last year.

Do you think anyone believes the current deficit will be less than last year?


FY 2018 Deficit May.jpg

Fiscal 2018 Deficit Through April

The graph below illustrates the monthly deficit or surplus for Fiscal 2018. 

The cumulative deficit through the end of April is $382 billion, which is $39 billion more than last fiscal year. The large surplus in April is primarily due to the payment of individual taxes that were due April 15th. Based on current projections, the federal government won't have another surplus month this fiscal year and the deficit will more than double over the next five months.

What are your thoughts about the Fiscal 2018 deficit?

FY 2018 Deficit April.jpg

Fiscal 2018 Deficit through March

The chart below compares the monthly deficit of Fiscal 2018 with Fiscal 2017. Through the first six months of the fiscal year, the federal government has overspent by $598 billion, which is $73 billion more than the prior year. As a percentage, the deficit is nearly 14% greater than one year ago.

The rate of growth in federal revenues has slowed since the beginning of January. Since most of the tax law changes became effective on January 1, this is not a complete shock, especially since the CBO projected the federal government would collect $1 trillion less over the next decade. Add in the additional spending approved through the Fiscal 2018 Omnibus appropriations bill, and the deficit will continue to increase throughout the rest of the fiscal year.

What do you think of the current increase of the federal deficit?

FY 2018 Deficit March.jpg

Fiscal 2018 Deficit Through February

Below is a graph tracking the deficit of the U.S. government by month, in comparison to the prior fiscal year. Through February 28, 2018 (five months into the current fiscal year), the federal government has overspent by $392 billion.

FY 2018 Deficit February.jpg

See the big blue line for February? That shows the federal government overspent by approximately $216 billion; just in February. Considering there are only 28 days in February, our government overspent by nearly $8 billion each day.

Any rational person would have to admit this is unsustainable, yet Congress seems to have little time, attention or political willpower to anything about it.

What do you think about the current spending pattern of the U.S. government?

Fiscal 2018 Deficit through January

Below is a graph comparing the monthly federal deficit for Fiscal 2018 in comparison to Fiscal 2017.

FY 2018 Deficit January.jpg

The deficit for the first four months of the fiscal year was $174 billion. This is $17 billion higher than the deficit for the first four months of 2017. January's surplus is primarily driven by individuals who pay their last installment of 2017 estimated taxes in early January.

Starting January 1, 2018, the U.S. Treasury expects to receive less tax revenue as a result of the tax reform legislation passed in December 2017. To avoid a government shutdown last in early February, Congress also agreed increase defense and discretionary domestic spending. Therefore, you can expect to see a the deficit each month continue to exceed the prior year, for the rest of Fiscal 2018.

Are you concerned with a rising federal deficit?

President Trump's Fiscal 2019 Budget

Fiscal 2019 Budget.jpg

President Trump released his Fiscal 2019 Budget plan this past week. It's rare for Congress to adopt a President's budget. However, it's the first step in the budgetary process, and it outlines the President's plans and priorities.

Below are some highlights of President Trump's plan.

  • Total Fiscal 2019 spending is projected to be $4.4 trillion, with $716 billion allocated for defense and $18 billion to build a wall along the southern border.
  • Additional $200 billion of spending for infrastructure, which was part of the President's $1.5 trillion infrastructure plan.
  • U.S. Gross Domestic Product (GDP) is projected to grow by 3% annually.
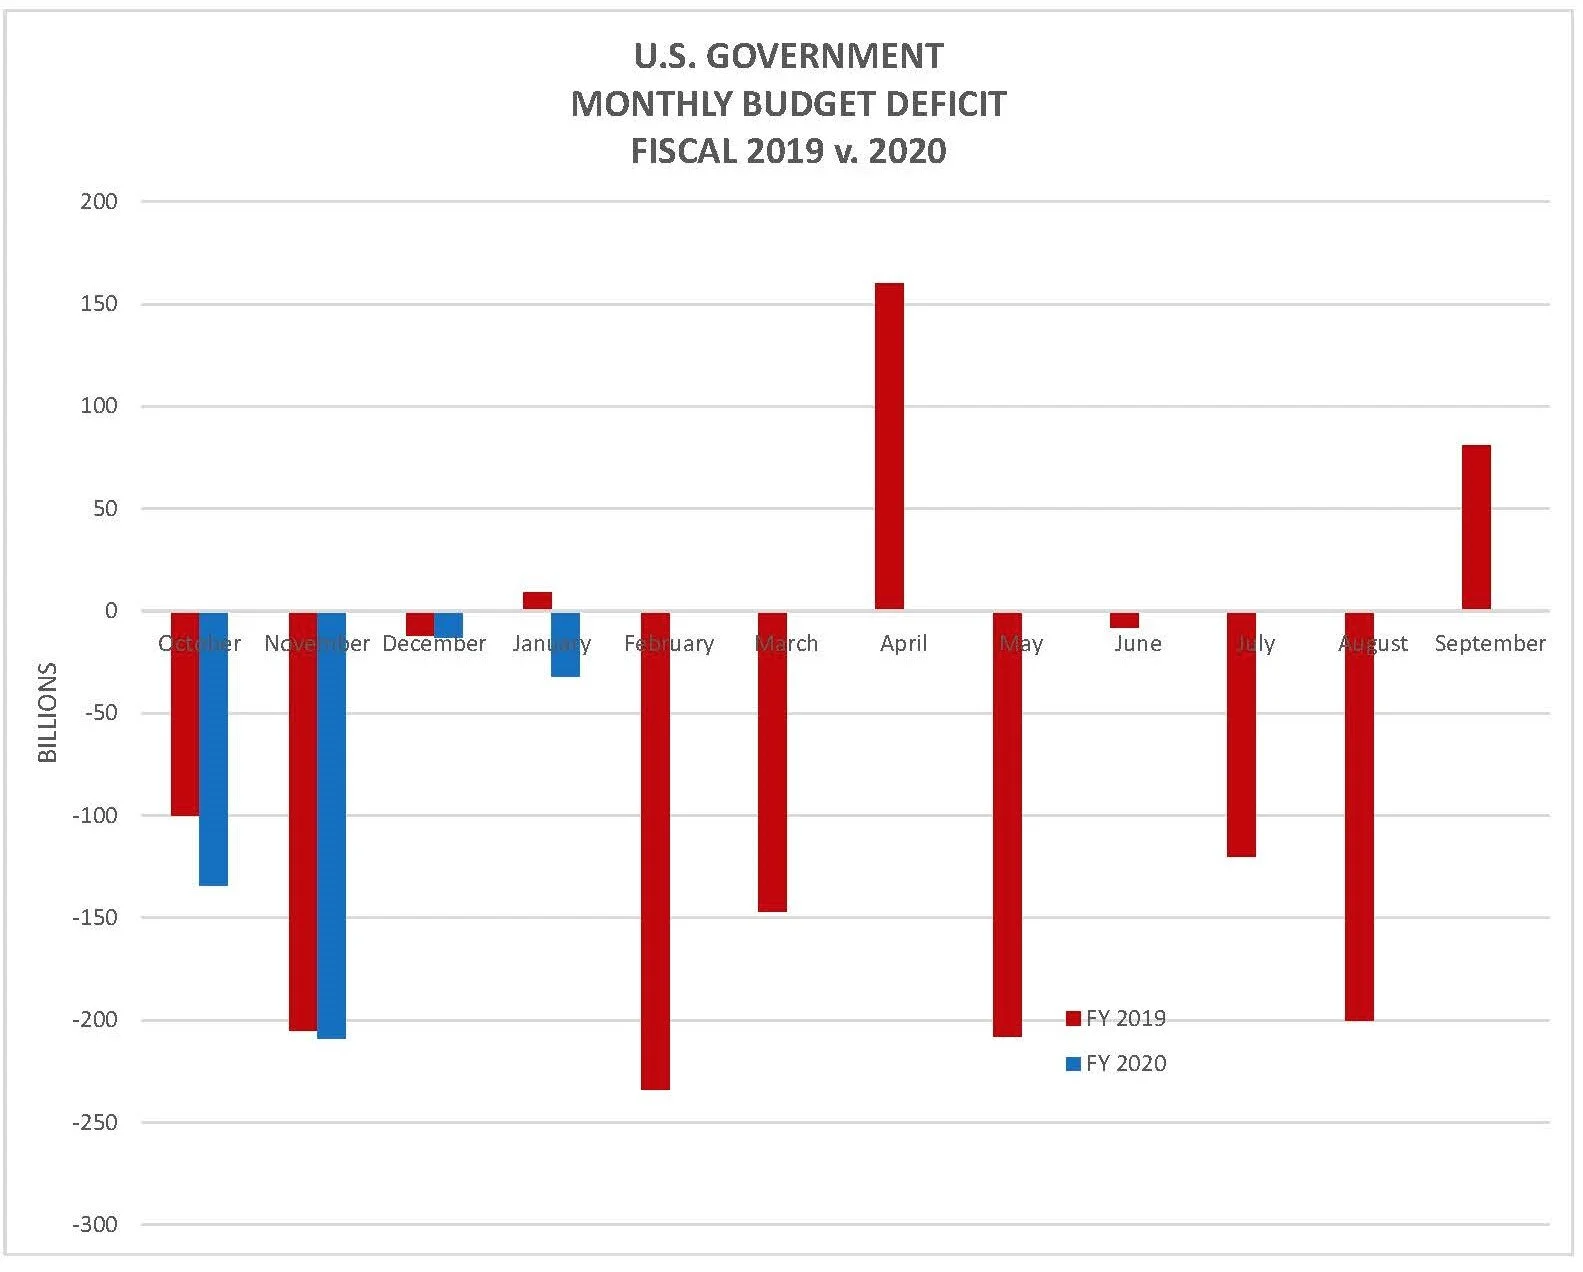
  • The Fiscal 2019 and 2020 deficits will be approximately $1 trillion each year before slowly decreasing.
  • The plan doesn't project a balanced budget within the next 10 years, and the deficit at the end of the decade is expected to be $450 billion.
  • The U.S. will overspend in excess of $7 trillion over the next decade, pushing the national debt to nearly $28 trillion.
  • The President wants to reduce domestic spending by more than $3 trillion over the decade, despite the agreement by Congress last week to increase domestic spending by $300 billion.

If you recall, President Trump campaigned on balancing the budget and addressing the $20 trillion national debt. Even though his budget isn't likely to become law, it demonstrates the difficulty our leaders face in trying to reduce federal spending and balance the budget. They may have good intentions, but the harsh realities of the difficult choices required and the potential political backlash make it near impossible to achieve.

This is just the first step in the budgetary process, but if the President, who campaigned on fiscal restraint, doesn't propose a balanced budget, don't expect Congress to pass one on their own.

U.S. Budget Deficit through November

Below is a graph tracking the monthly federal deficit for Fiscal 2018, which runs from October 2017 through September 2018.

FY 2018 Deficit November.jpg

The federal government overspent by $198 billion in October and November. This compares to the $181 billion deficit through November 2017. Revenues and expenditures both grew at 6% over last year. Since annual expenditures exceed revenues by $600 billion, the cumulative deficit is greater than last year.

Congress has yet to pass the required appropriations for Fiscal 2018, and current spending is determined by temporary funding measures. The current shot-term Continuing Resolution ends January 19, 2018.

Do you think the spending measures approved by Congress will increase or decrease the budget deficit for this year?

The Fiscal 2017 Deficit

The U.S. government's fiscal year ended on September 30, and a new year began on October 1. The Congressional Budget Office (CBO) estimates the Fiscal 2017 deficit was $668 billion, which is $81 billion more than Fiscal 2016. A year ago, the CBO was projecting the Fiscal 2017 deficit would be less than Fiscal 2016, not $81 billion more. The chart below compares the monthly deficit or surplus to the prior year.

FY 2017 Deficit September.jpg

Total government revenues increased by 1%, but expenditures increased by nearly 3%. As a percentage of Gross Domestic Product (GDP), the Fiscal 2017 deficit was approximately 3.5% of GDP, up from 3.2% in Fiscal 2016. It's also the second consecutive year the deficit rose as a percentage of GDP, which indicates government spending is growing faster than the U.S. economy.

We're already two weeks into the new fiscal year, and Congress is still a long ways from deciding on government spending for the coming year. To prevent a government shutdown, Congress approved a Continuing Resolution, that effectively continues all Fiscal 2017 spending until mid-December. Since it's unlikely Congress will enact the necessary monetary legislation until close to the deadline, spending for nearly one-fourth of the year will be equal to or greater than last year. Unless Congress enacts spending cuts (which it has been unable to do so far), they have created a situation where the Fiscal 2018 deficit will likely be higher than the most recent $668 billion deficit.

Are you concerned the federal government spent $668 billion more than it received during the last year?

Trump's Tax Plan

Tax Reform.jpg

President Trump and several prominent members of Congress provided a framework of their tax reform plan earlier this week. The plan is intended to reduce the tax burden for most taxpayers, including individuals and corporations. There are a lot of details to be worked out, but below is a quick summary of their proposals.

  • Currently, there are seven different tax brackets, which will be reduced to three: 12%, 25% and 35%.
  • The standard deduction will be increased to $12,000 for individuals and $24,000 for married couples filing jointly.
  • Most itemized deductions will be eliminated, except for charitable contributions and mortgage interest. The deduction for state income taxes will be eliminated, which could be significant for taxpayers living in states with high income taxes (e.g., California and New York).
  • The top corporate rate will be 20%; down from 35%.
  • Business income from pass through entities (S Corporations, LLCs and partnerships) will be taxed at a maximum 25% rate.
  • The Alternative Minimum Tax (AMT) will be repealed.
  • Asset purchases (except for buildings) will be fully expensed in the year of purchase, at least for the next five years.
  • All business tax credits, except for the research and low-income tax credits, will be repealed.
  • Multinational corporations will be able to repatriate income from their foreign subsidiaries tax-free.
  • The estate tax is repealed.

The goal is to reduce the tax burden and simplify compliance. You may read some of the prior articles below on Tax Reform Principles that should be encompassed in a good tax reform plan. Time will tell if this plan will promote economic activity, is fair to all taxpayers and is simple to comply with. As with most tax legislation... the "devil is in the details," and we'll keep you updated as more details become available.

What do you think about this framework? Do you like it or think it's a bad idea?